Dashboard · Ad Tech · 2021
Publisher Portal 2.0
Reorganised a fragmented analytics portal into a clear, navigable revenue dashboard.

Publishers came to the portal to answer one question: where is my revenue coming from? The old interface made that surprisingly hard. The redesign rebuilt the information architecture, navigation, and reports so the answer is one glance away, split by media and ad type. One constraint shaped it throughout: customers had to keep full access to their existing production data and reports while the new portal and its features rolled out.
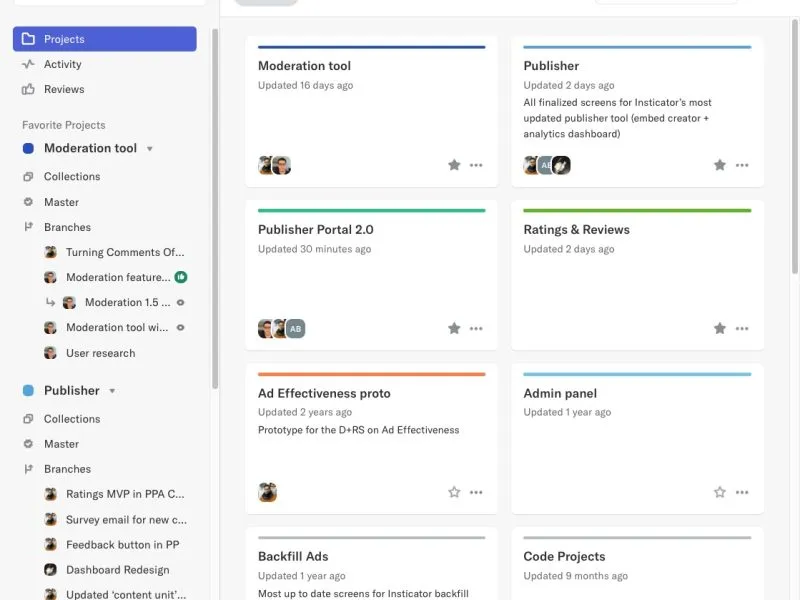
Understanding the existing interface
Publishers struggled to find the metrics that mattered. Aggregate data was split across many cards that often had no relationship to each other, and deeper insight meant opening a separate “View details” page, which lost context every time. Navigation sat across the top with no room to grow, so new sections had nowhere to go.
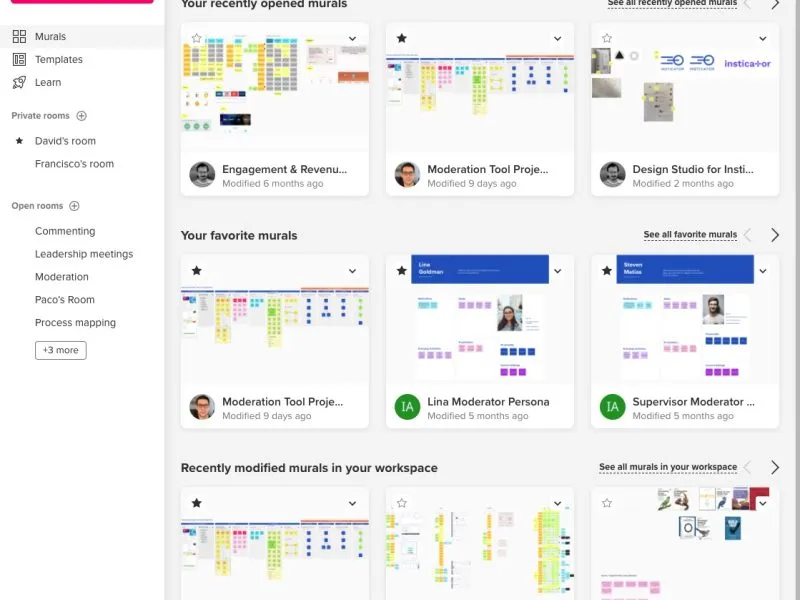
Research and analysis
Before redrawing the IA, I ran a short competitor analysis. The pattern was clear: the industry had moved to left-hand drawer navigation, which scales far better than a top bar.
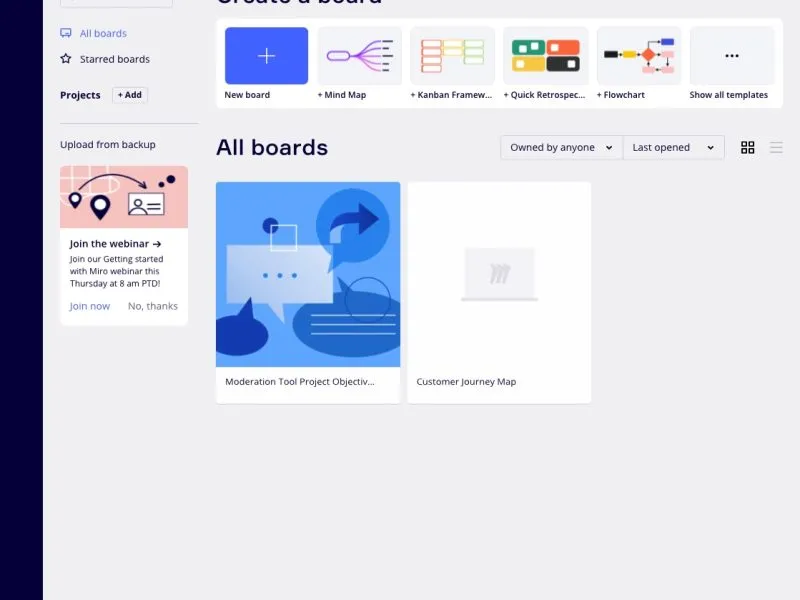
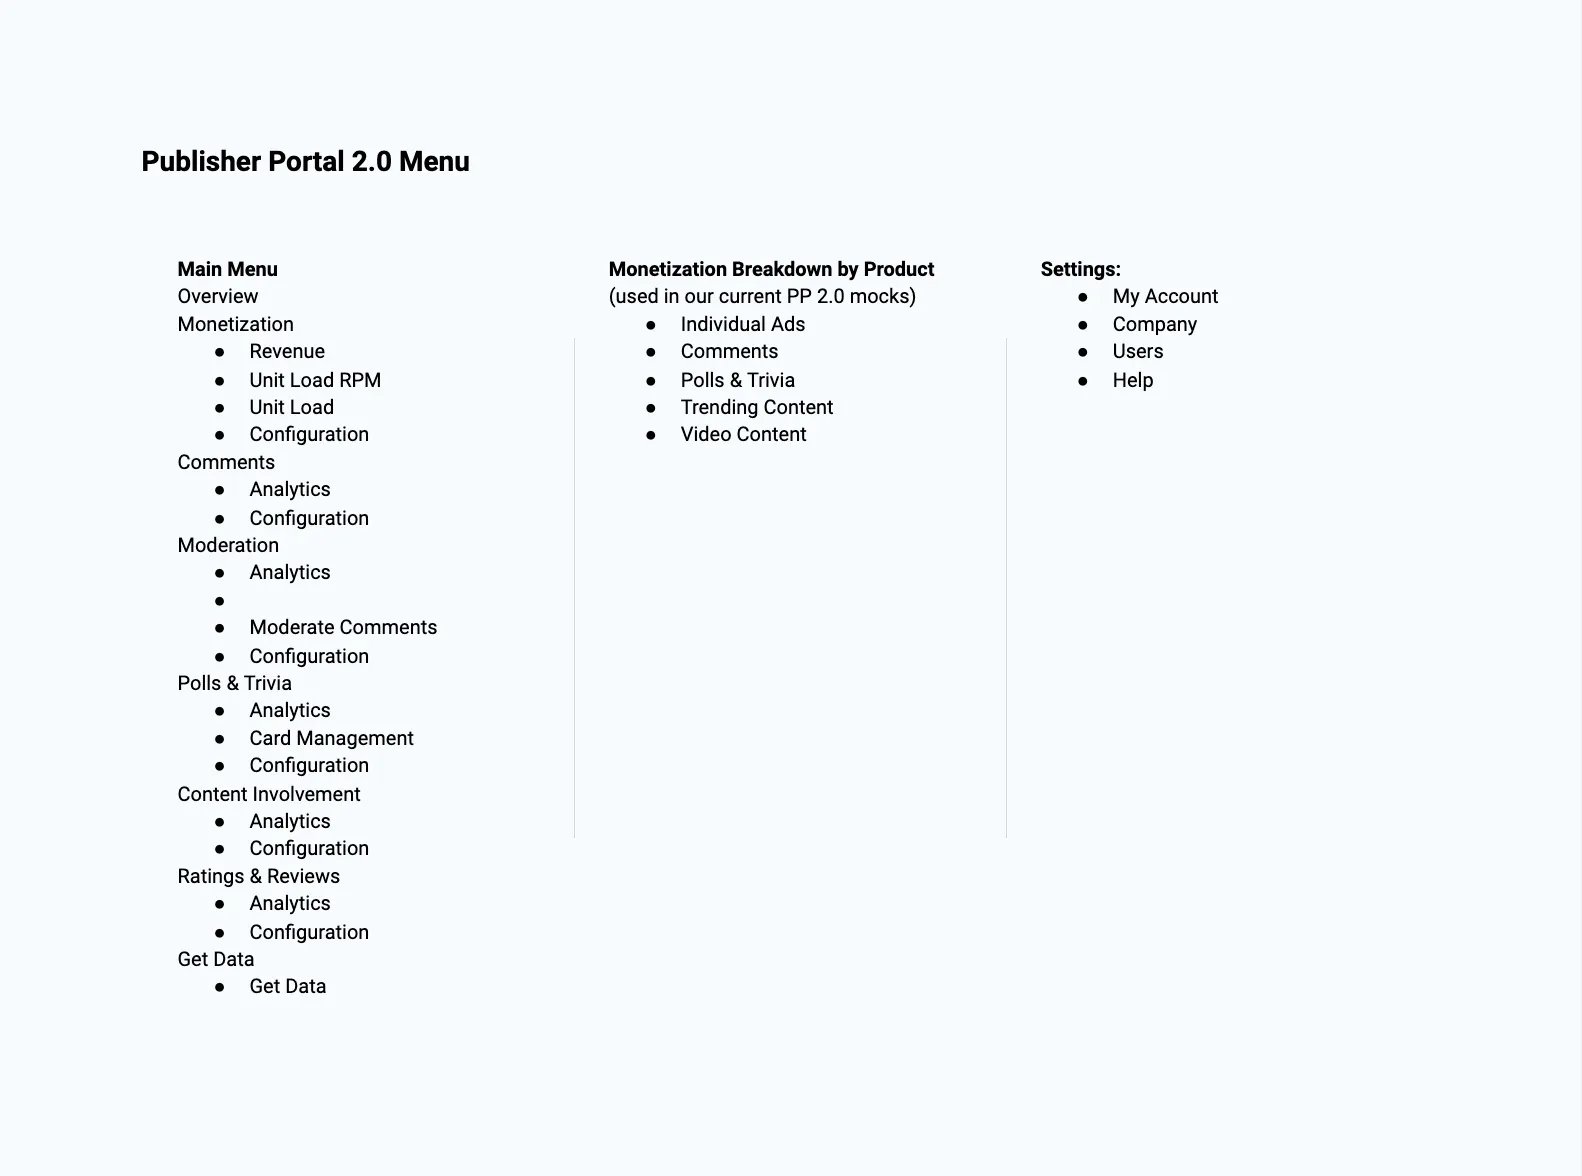
Information architecture
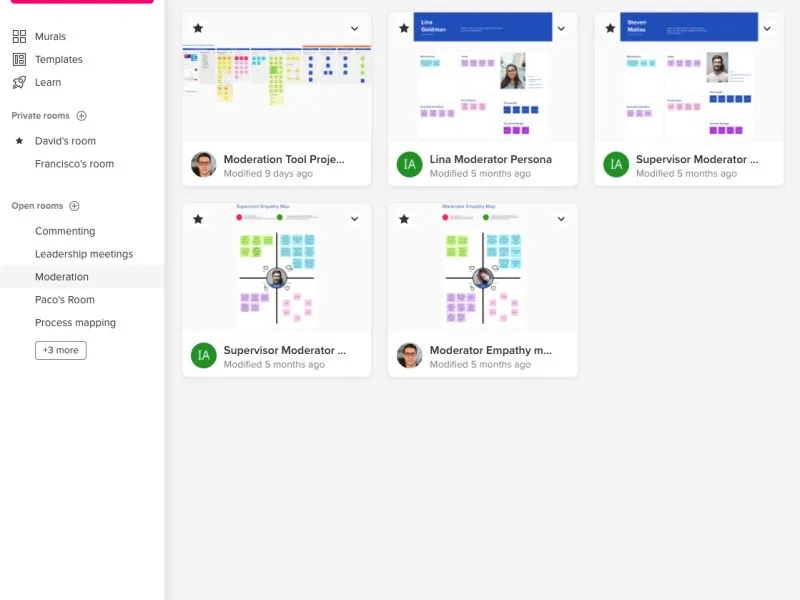
I drew a new IA map for the menu structure so the whole team agreed on the shape of the portal before any screens were designed.
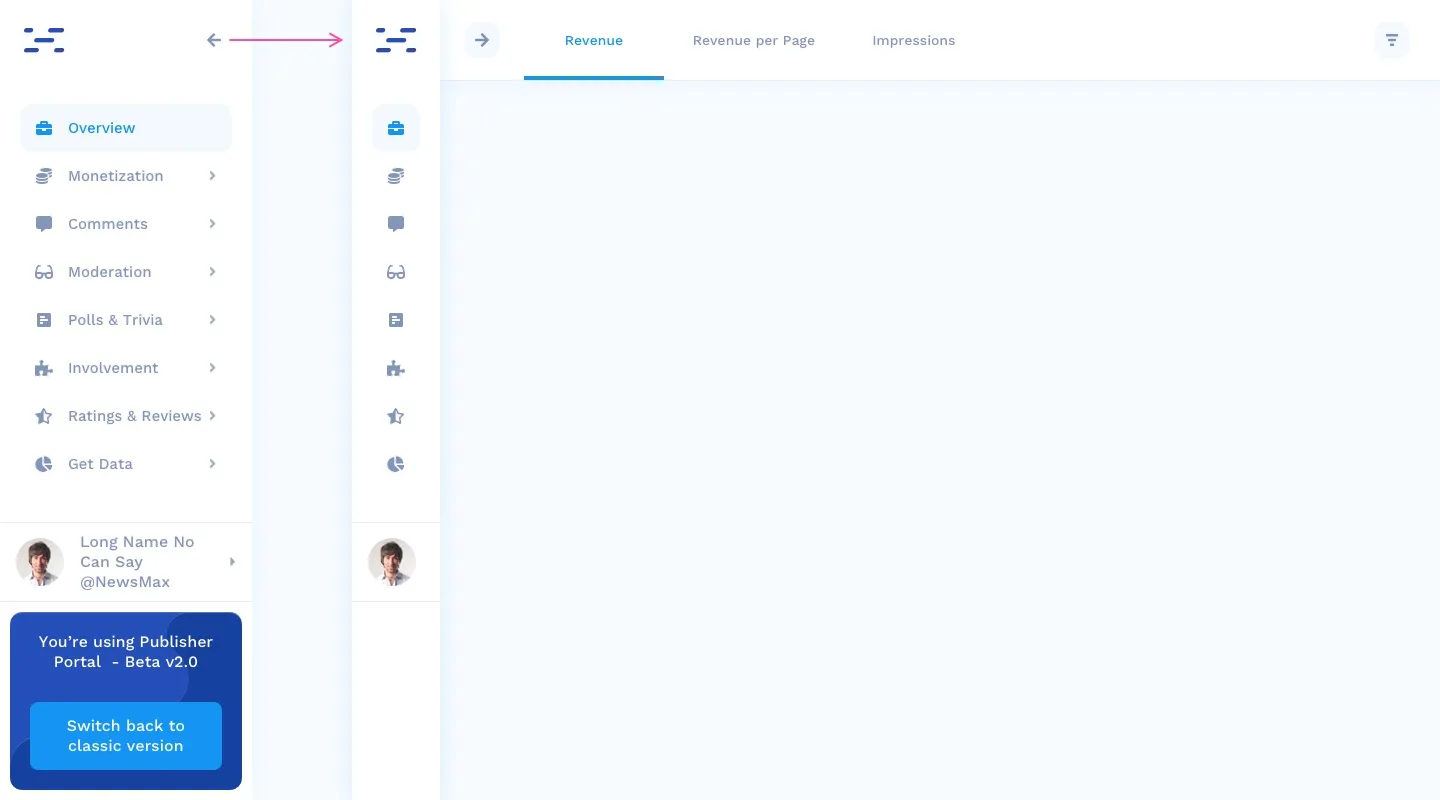
Navigation redesign
Whiteboarding, wireframes, UI, and testing with internal and external teams led to one decision: move the menu to a vertical rail on the left. It can take new items without limit, and it collapses to icons, handing the right side of the screen back to the content.

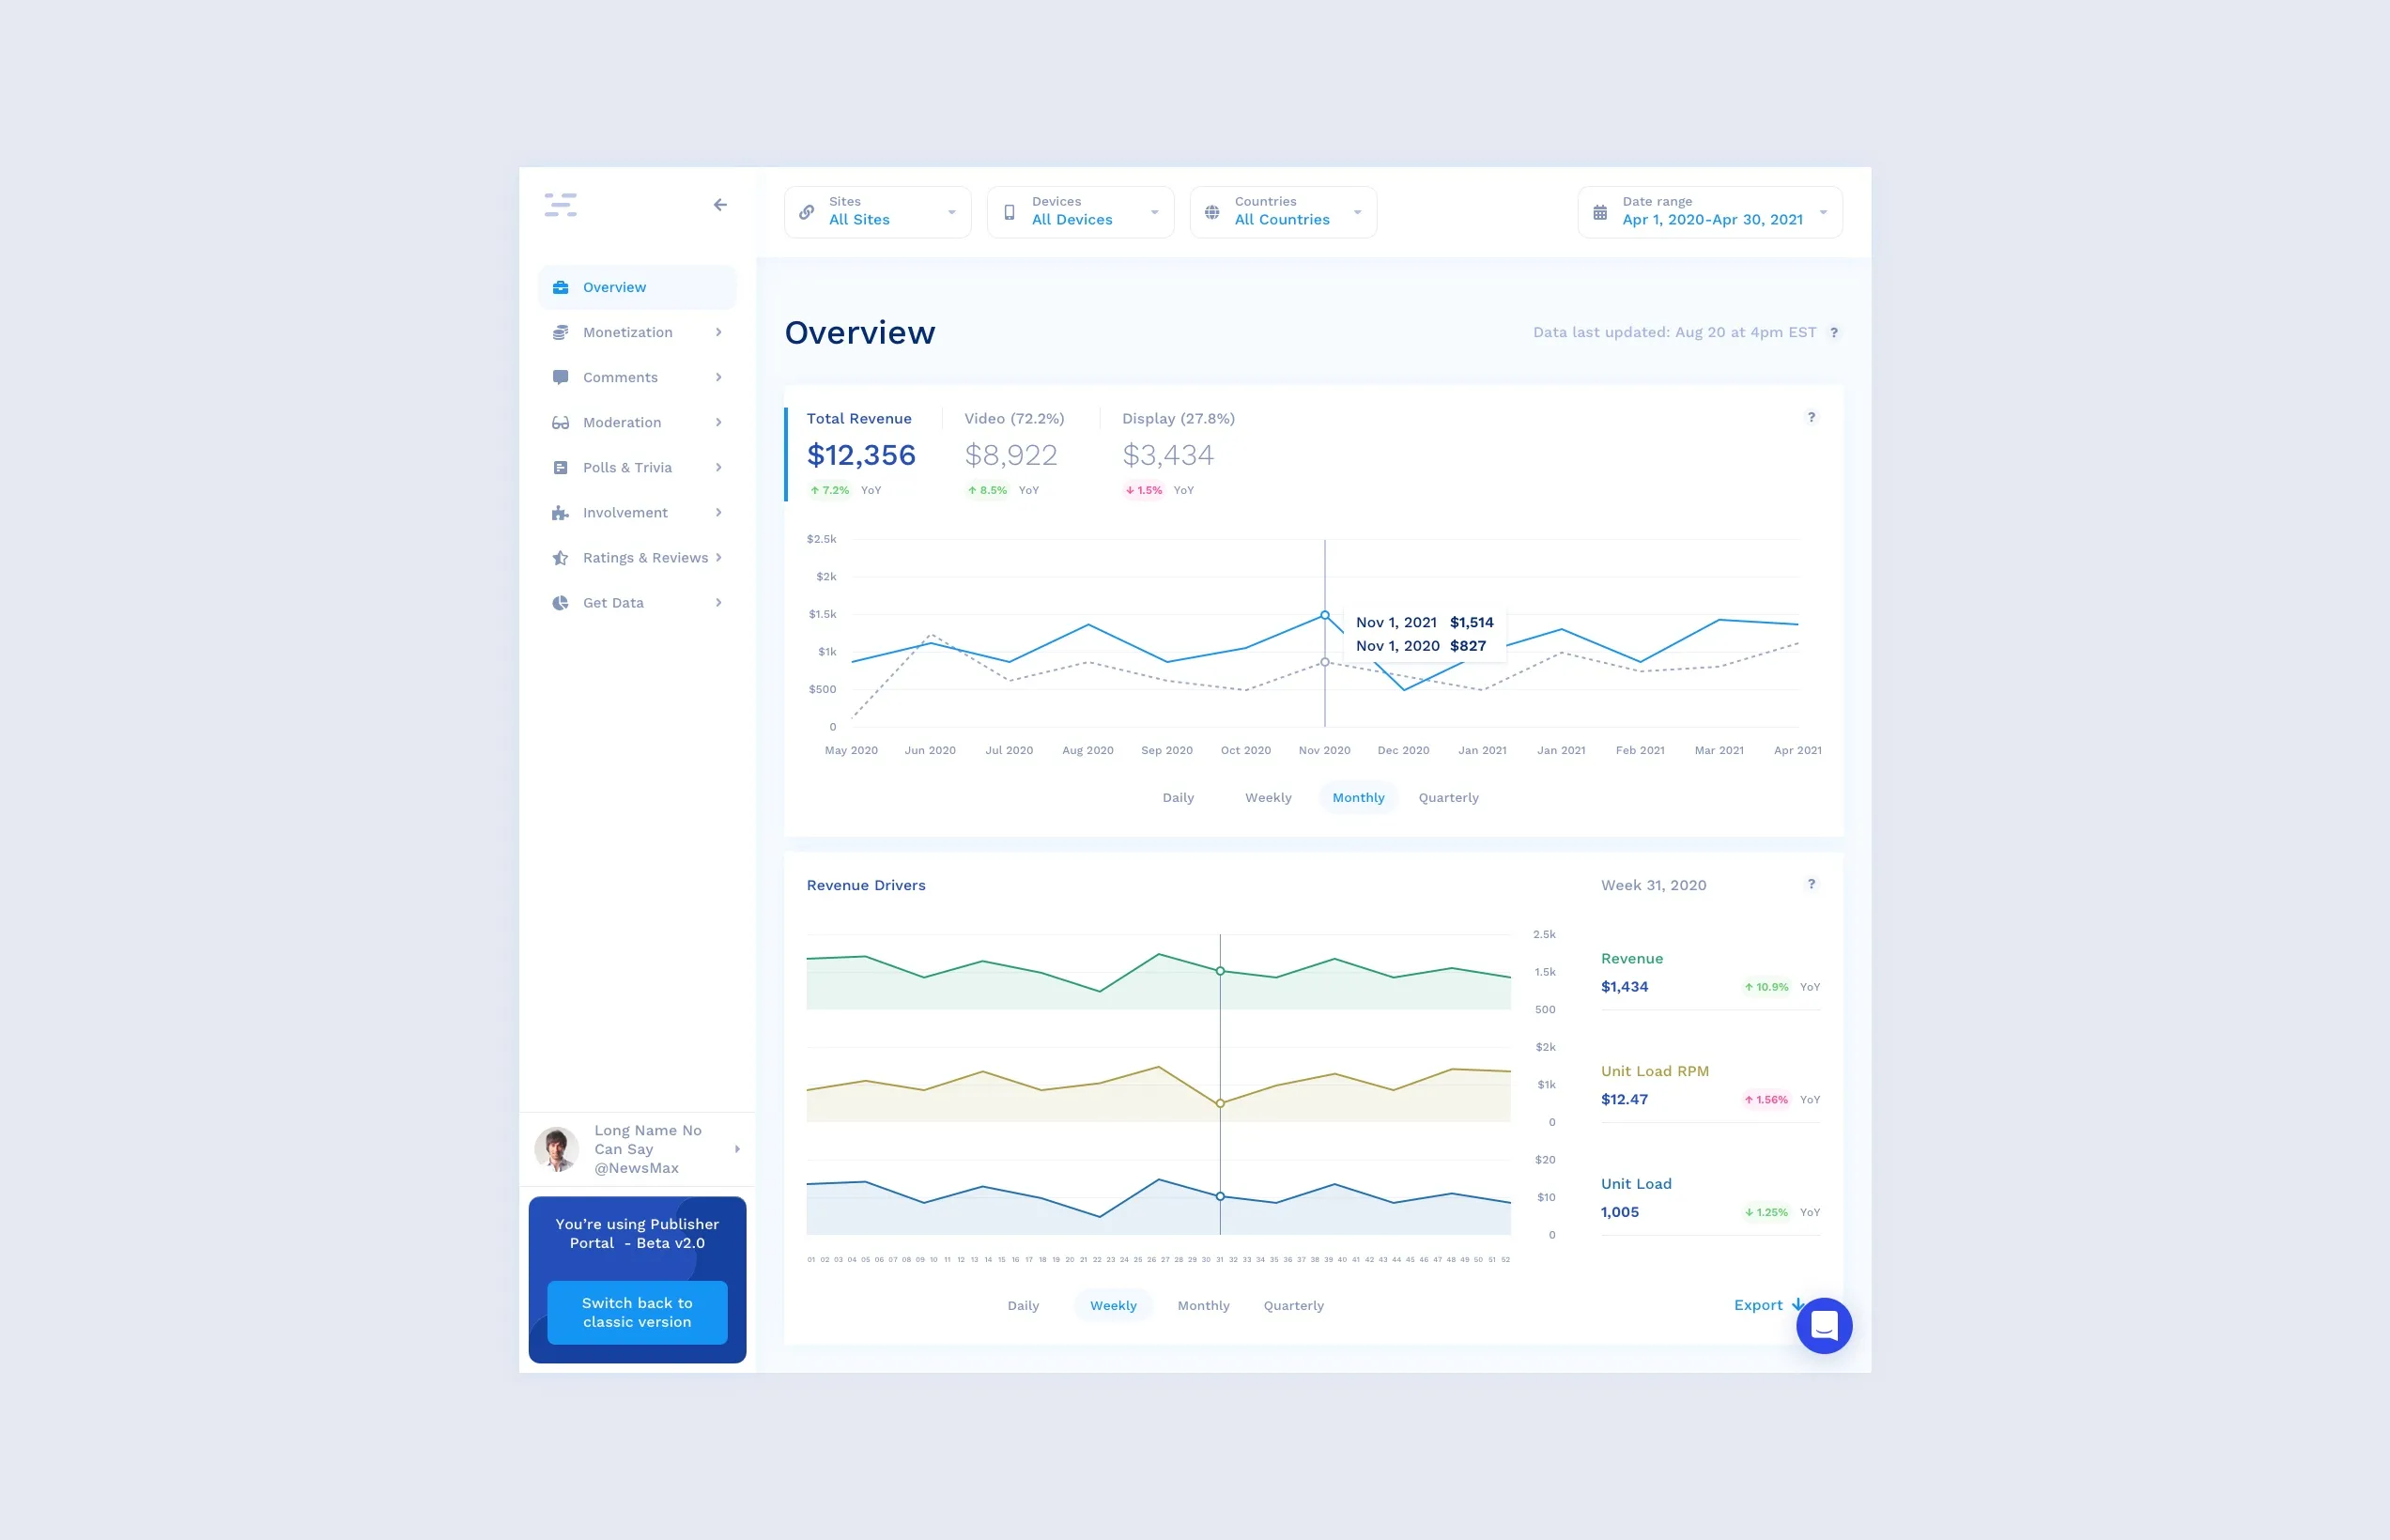
Reading revenue at a glance
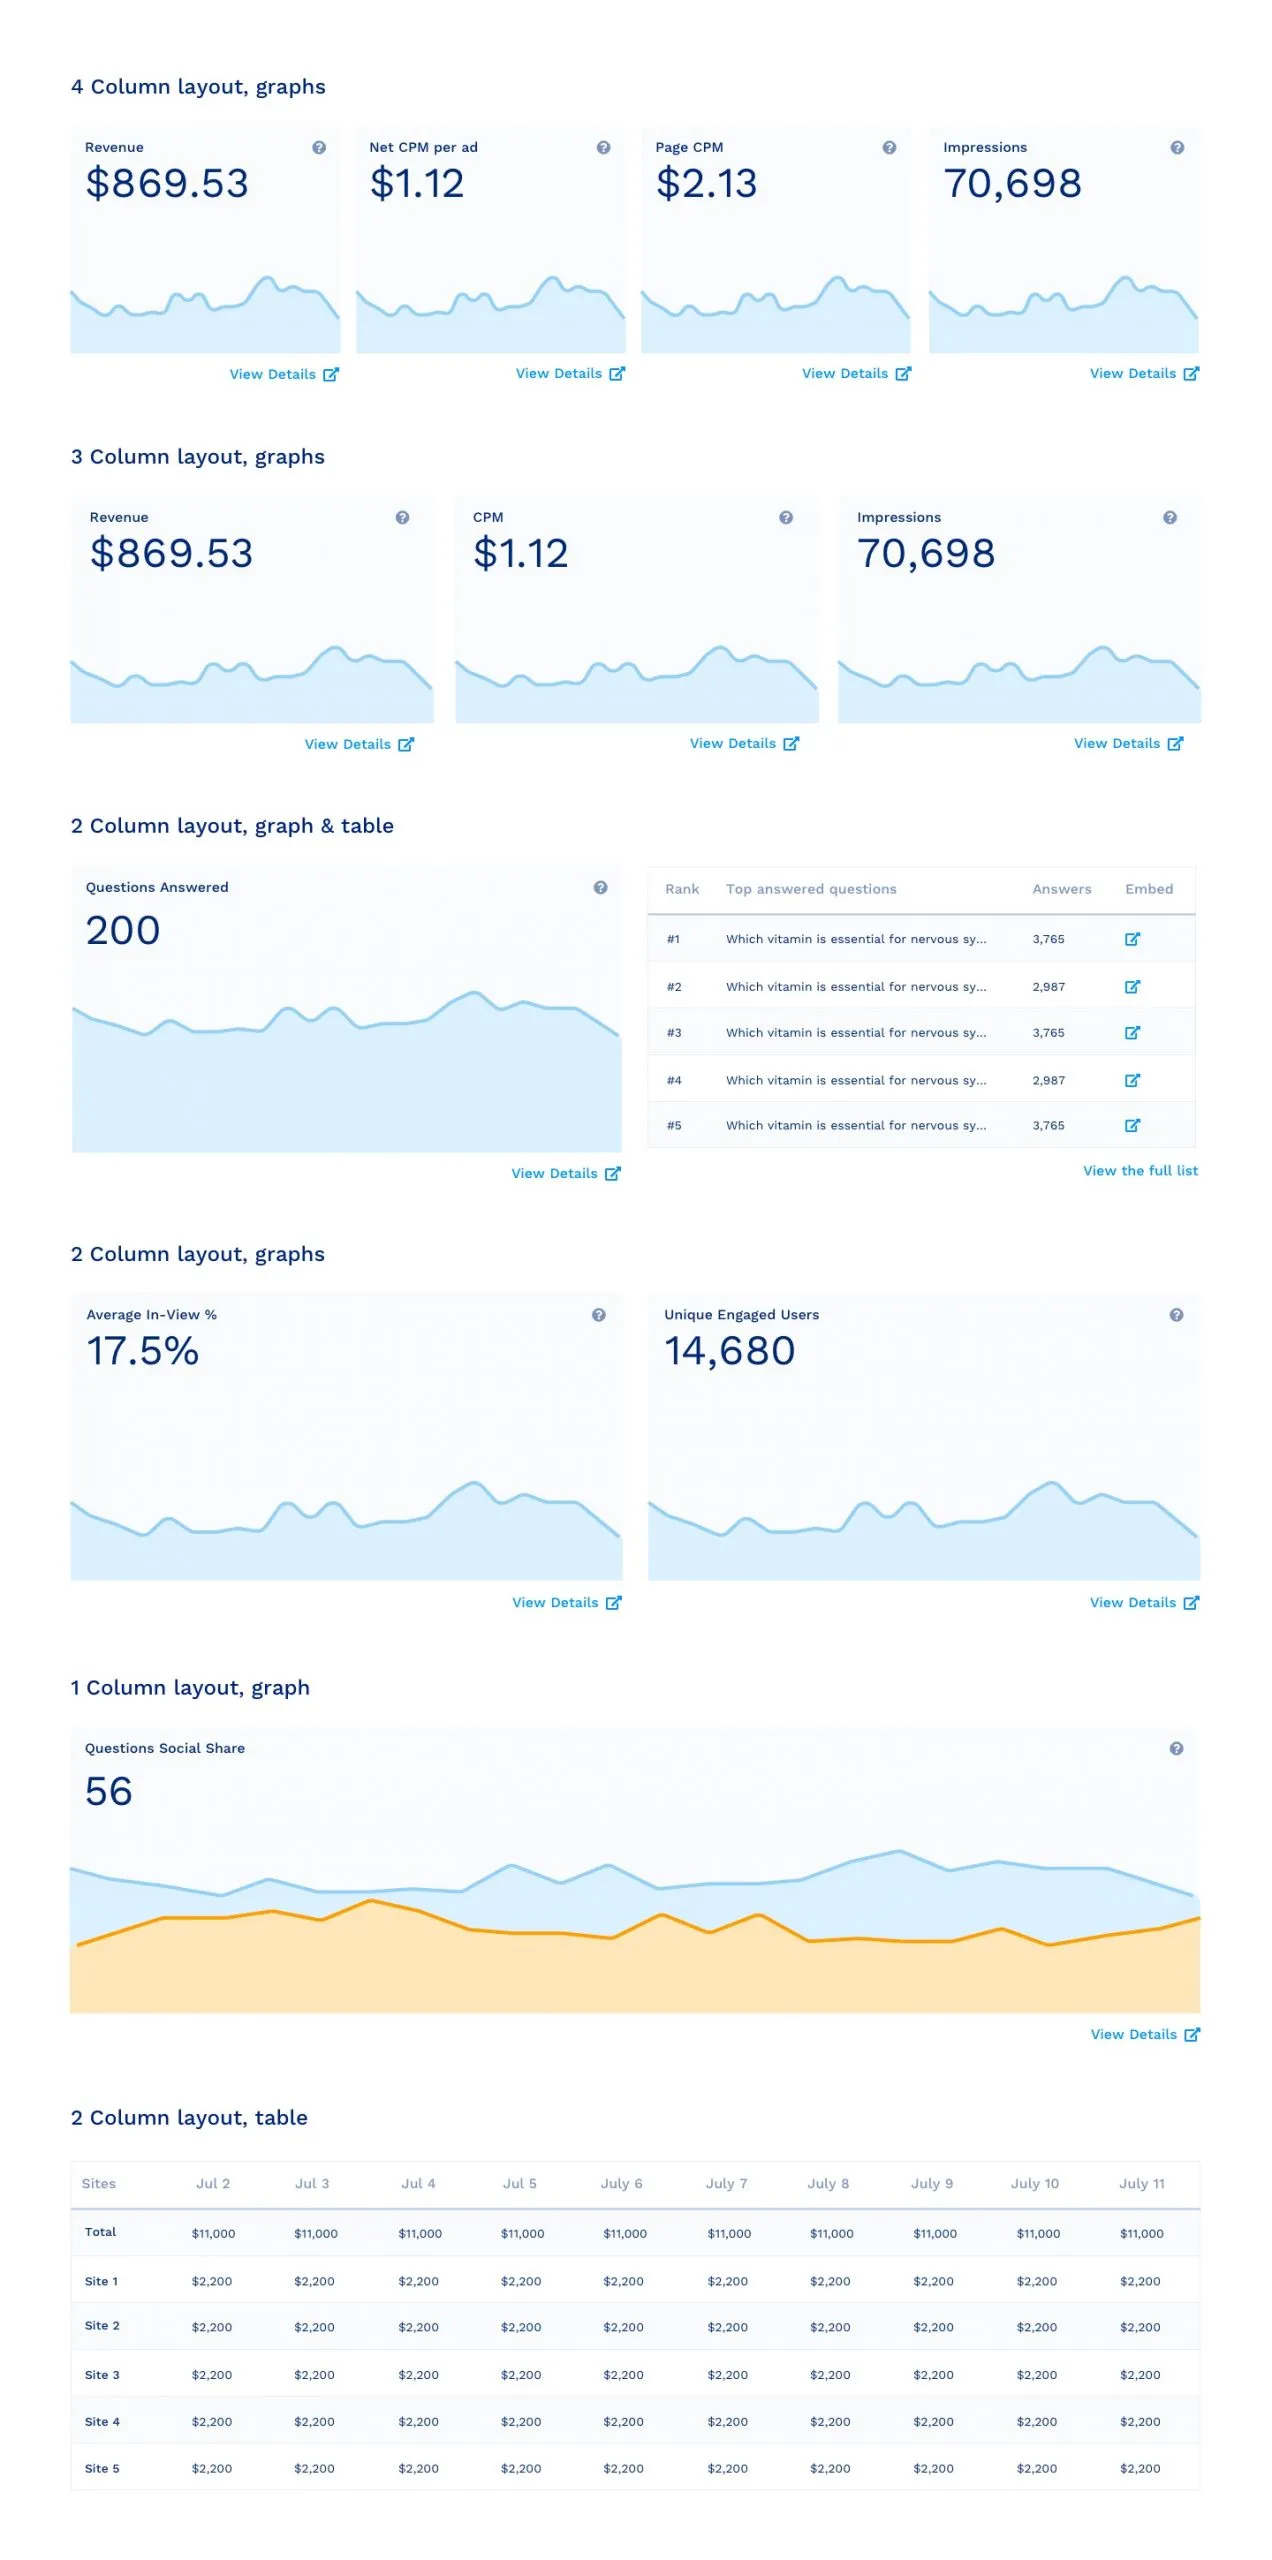
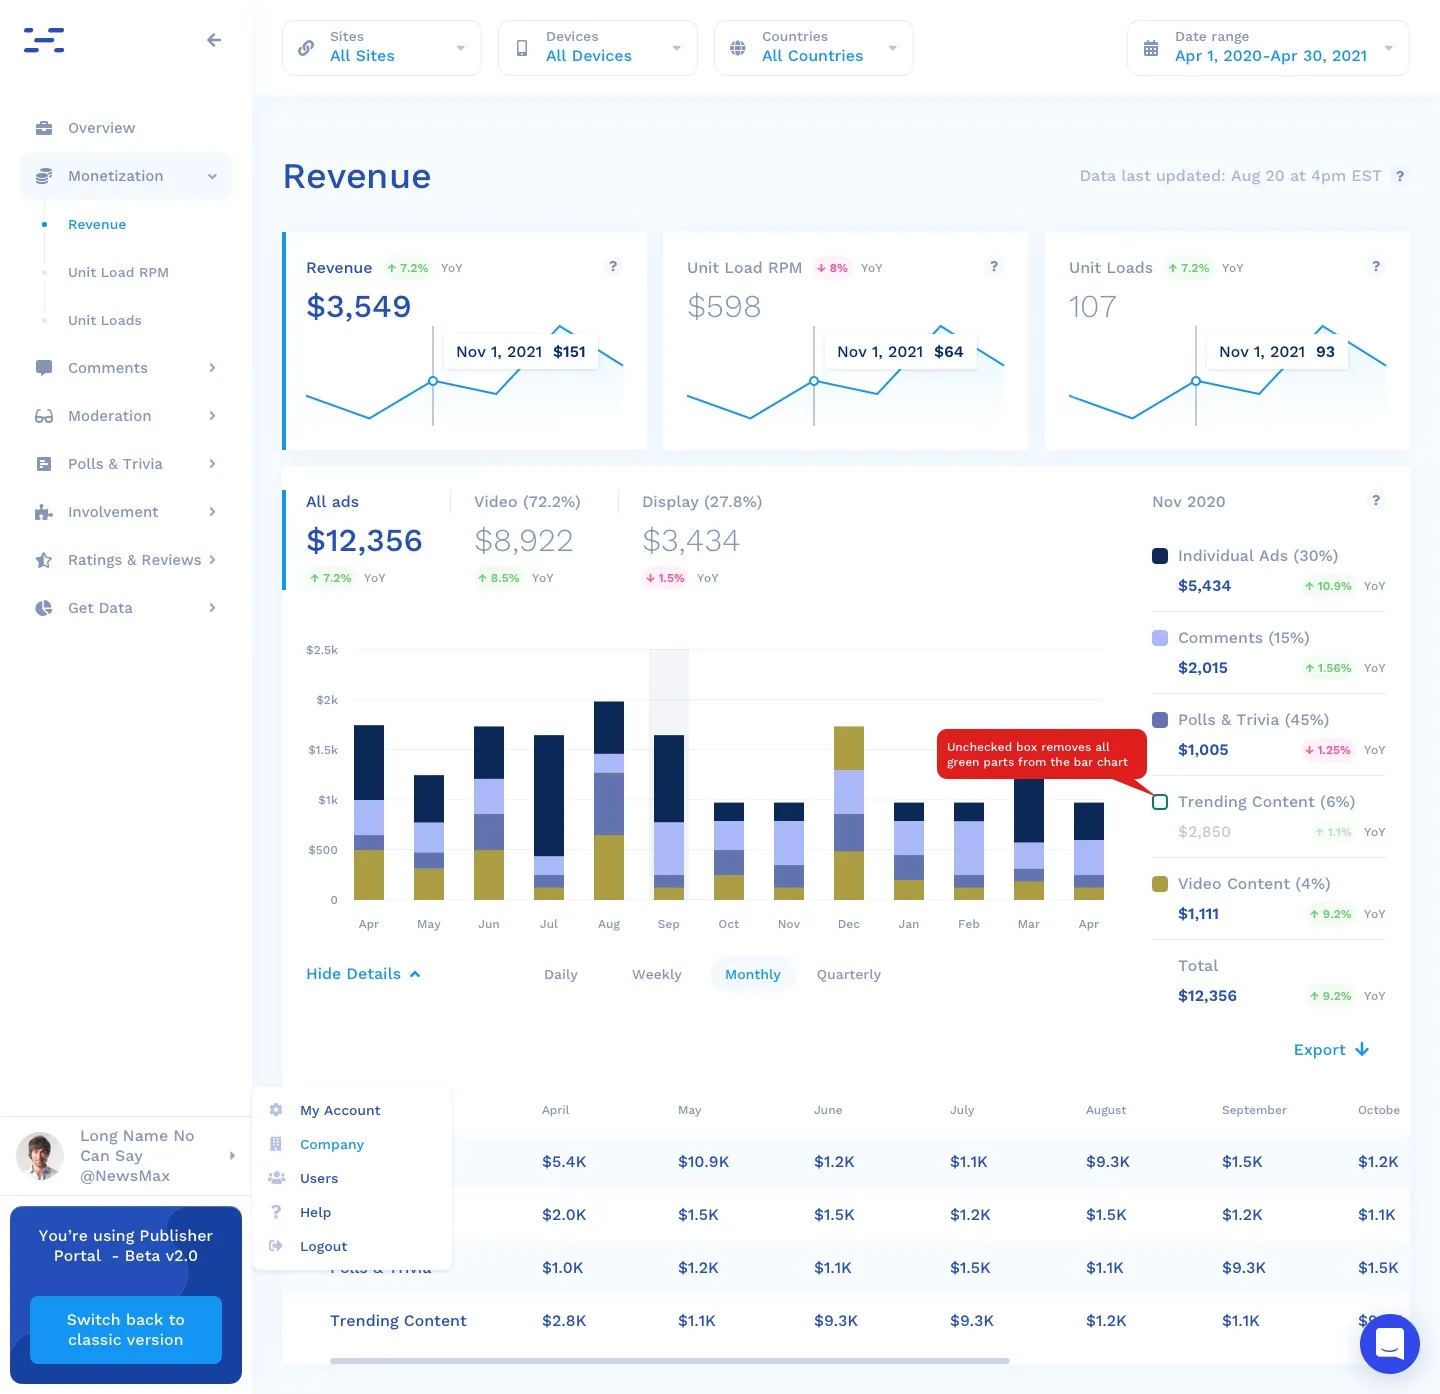
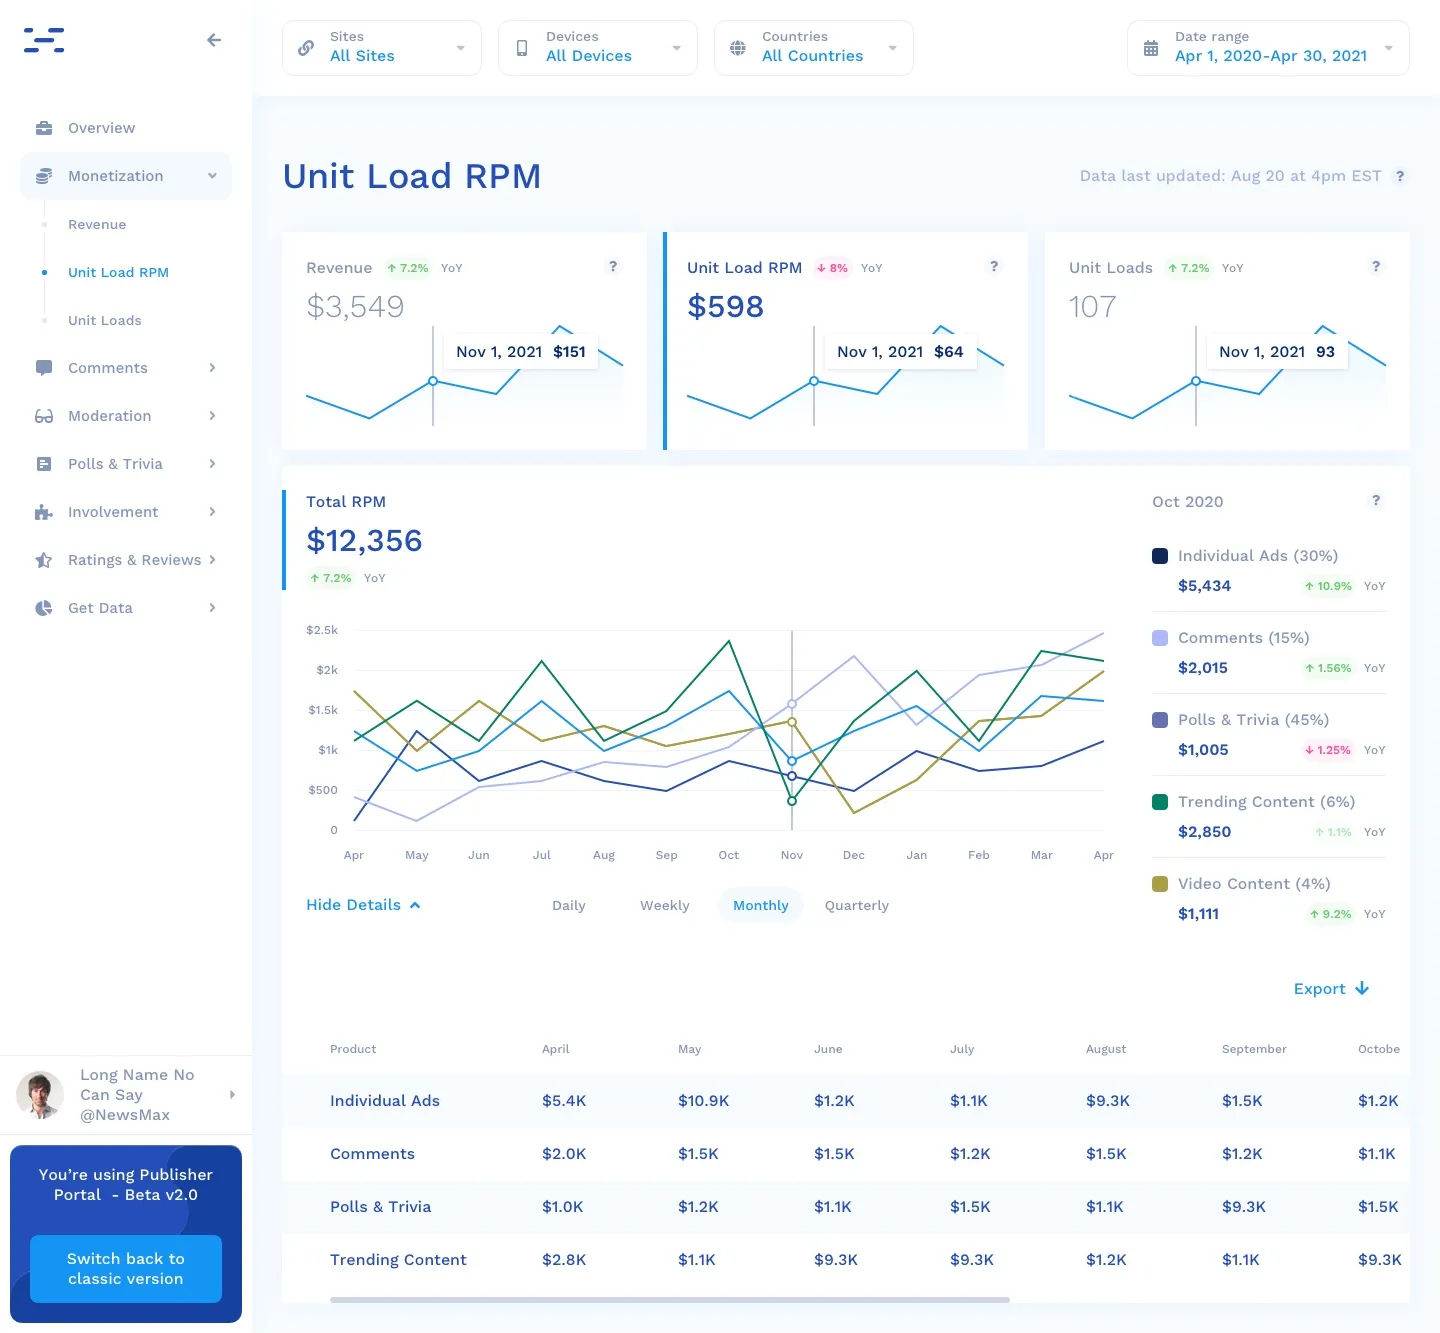
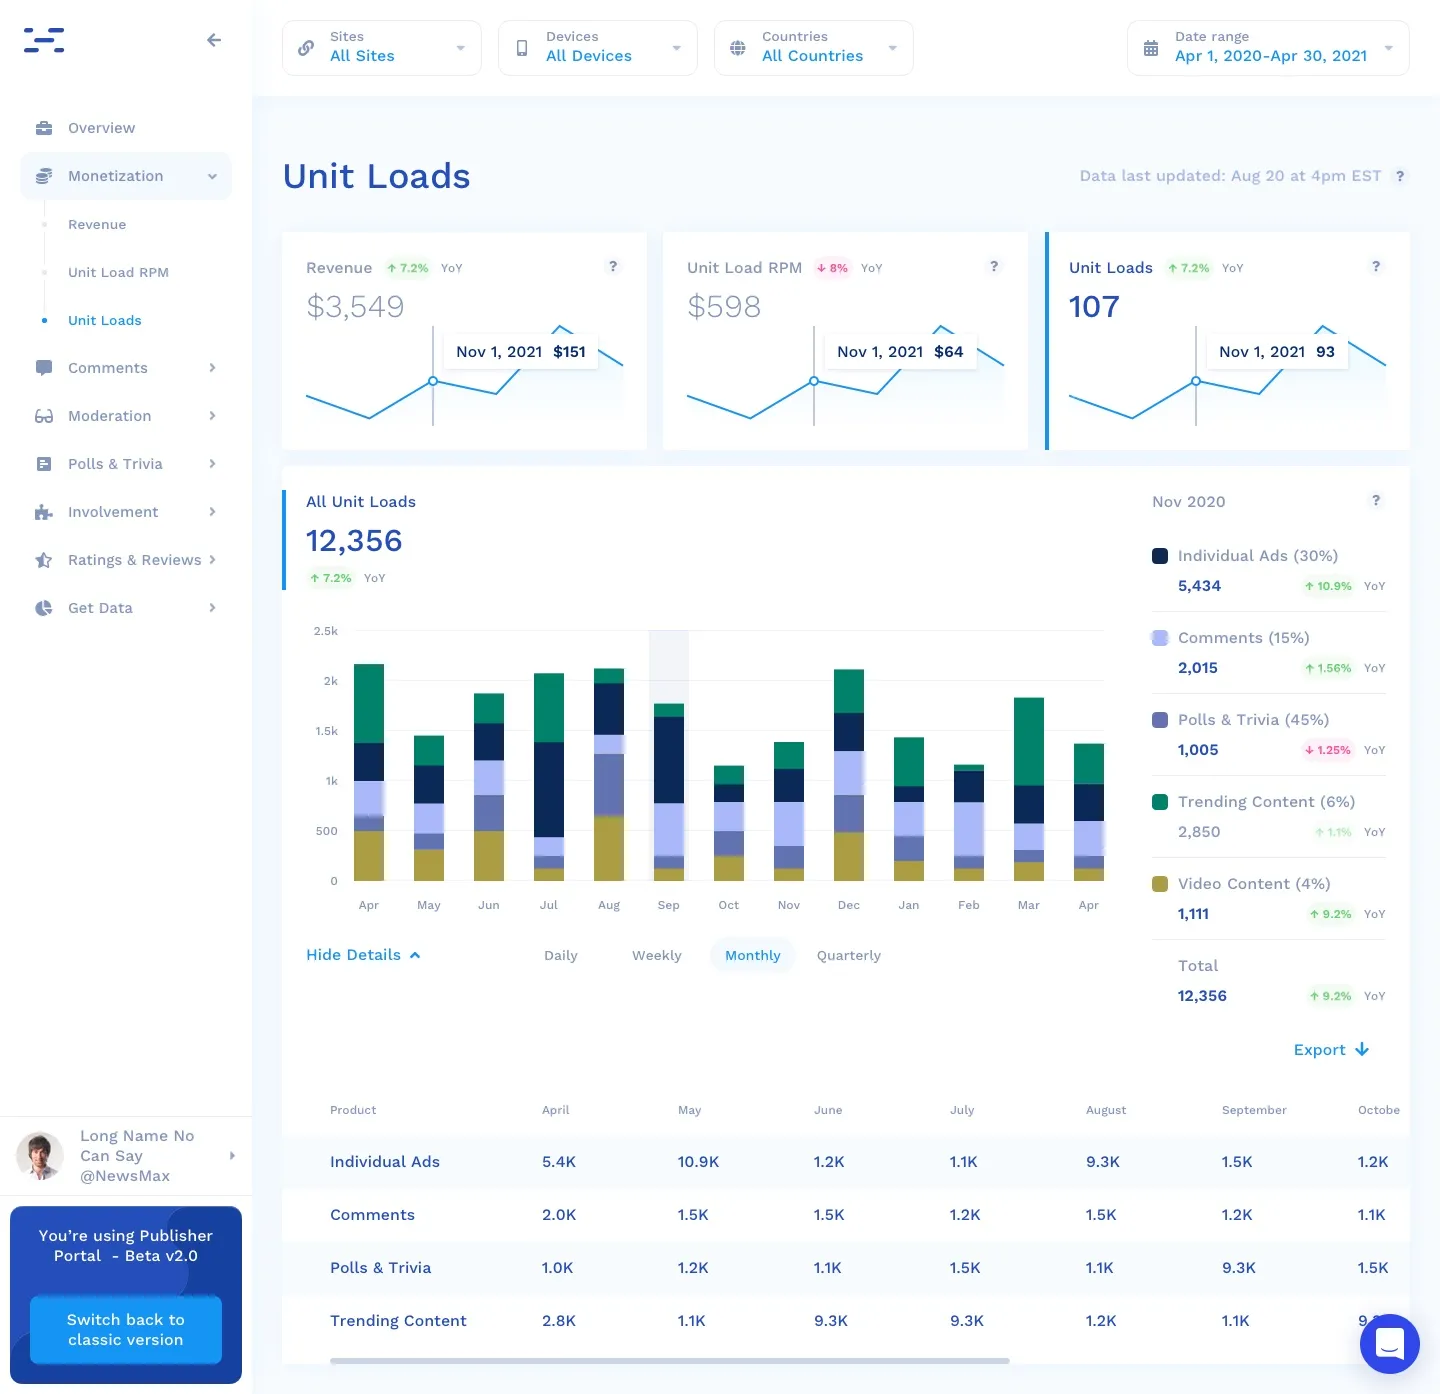
Each report leads with three compact cards spanning the page, giving instant context across the revenue drivers, rolled up by day, week, month, and quarter.
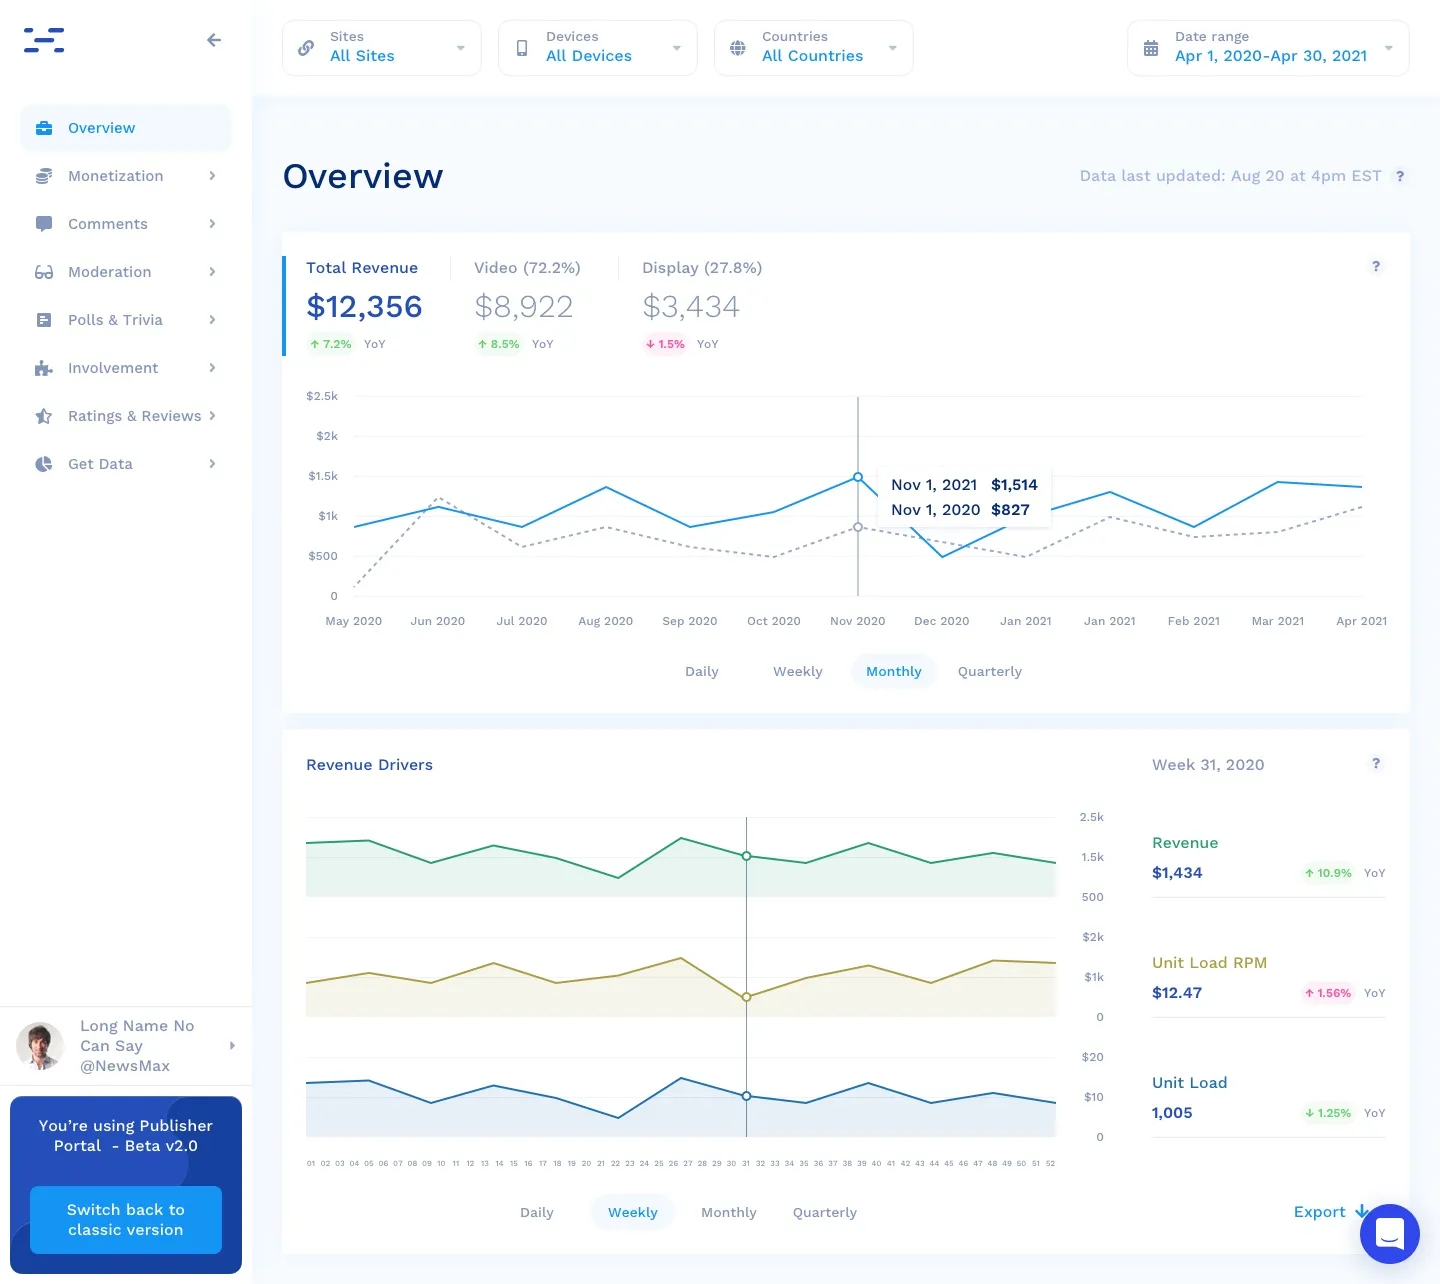
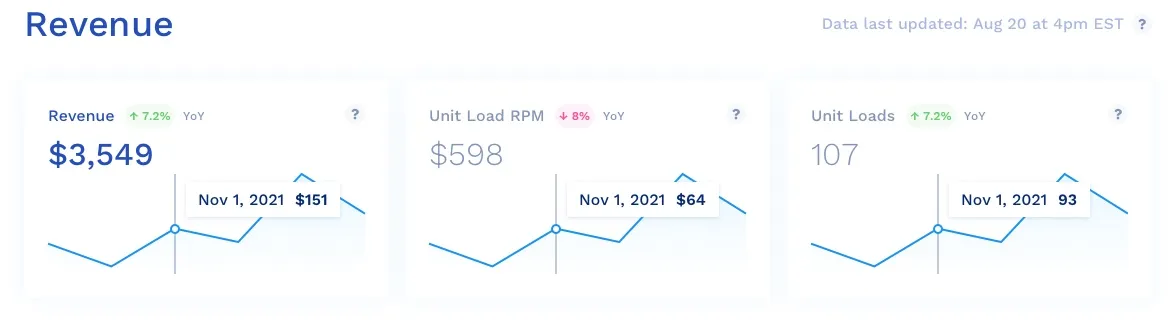
The Revenue, Unit Load RPM, and Unit Loads tabs share one layout, so moving between them costs no relearning. I used stacked bars for additive data and multi-line charts where metrics live on different axes.
The small things that get used most
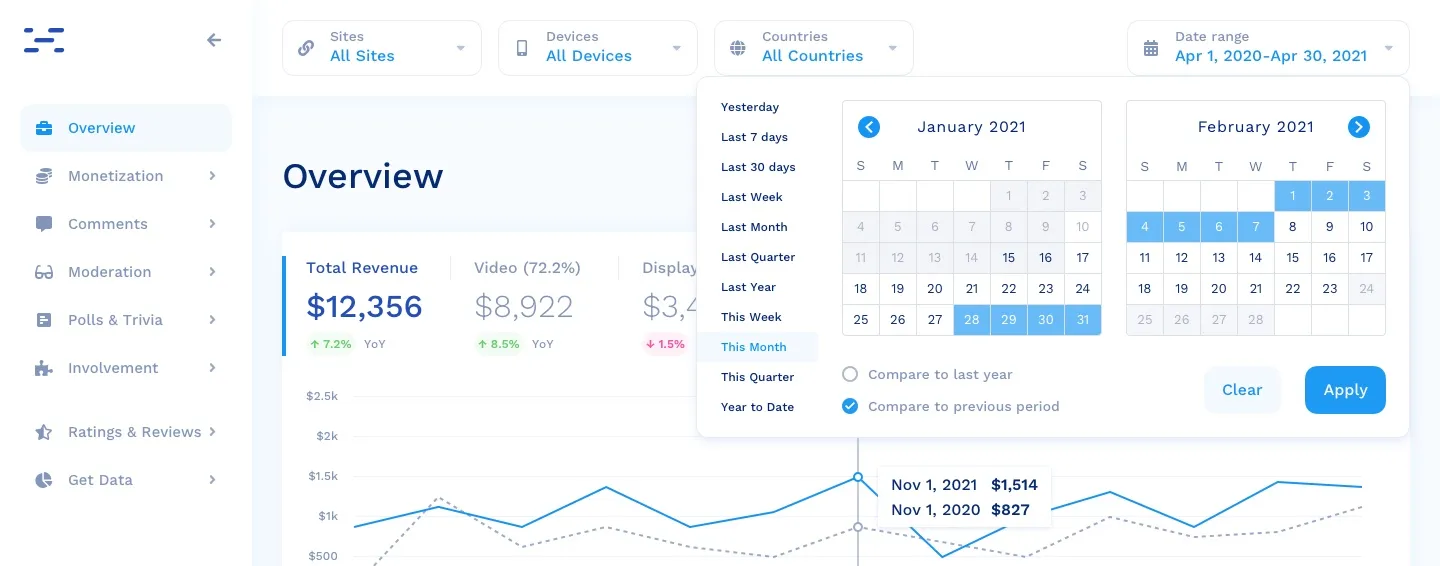
The date picker gets touched on nearly every visit, so it earned real attention. Presets like Yesterday, Last 7 days, and This Month cover the common cases, and built-in comparison against the previous period or last year answers the next question before it is asked.
Results and takeaways
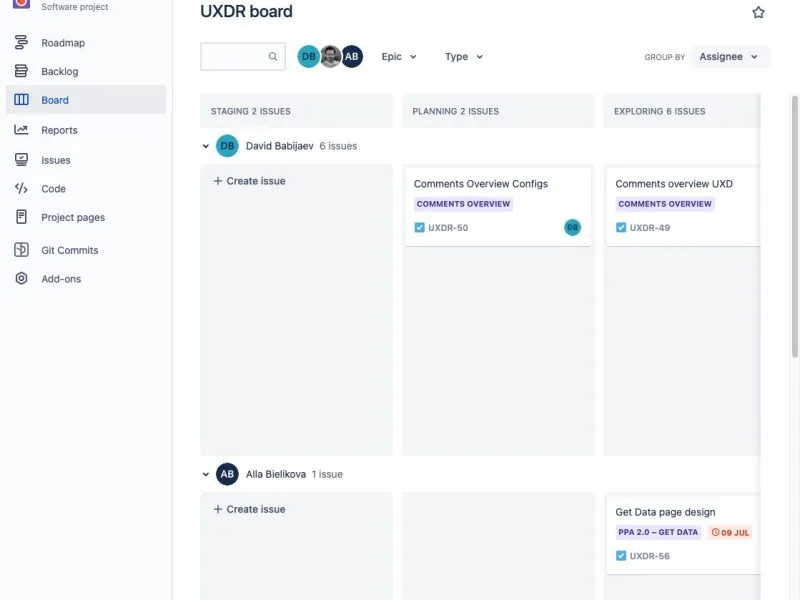
The work shipped as more than screens: a final review with engineering, design, PMs, and the VP of product, close coordination to fit the existing architecture, and interviews with the team during the build. What landed was a professional, lightly playful portal backed by a reusable component library, with a clearer hierarchy and a short path from question to answer.